
“Occurrences in this domain are beyond the reach of exact prediction because of the variety of factors in operation, not because of any lack of order in nature.” –- Albert Einstein
Parental guidance: The following plot may not be suitable for those with delicate constitutions.
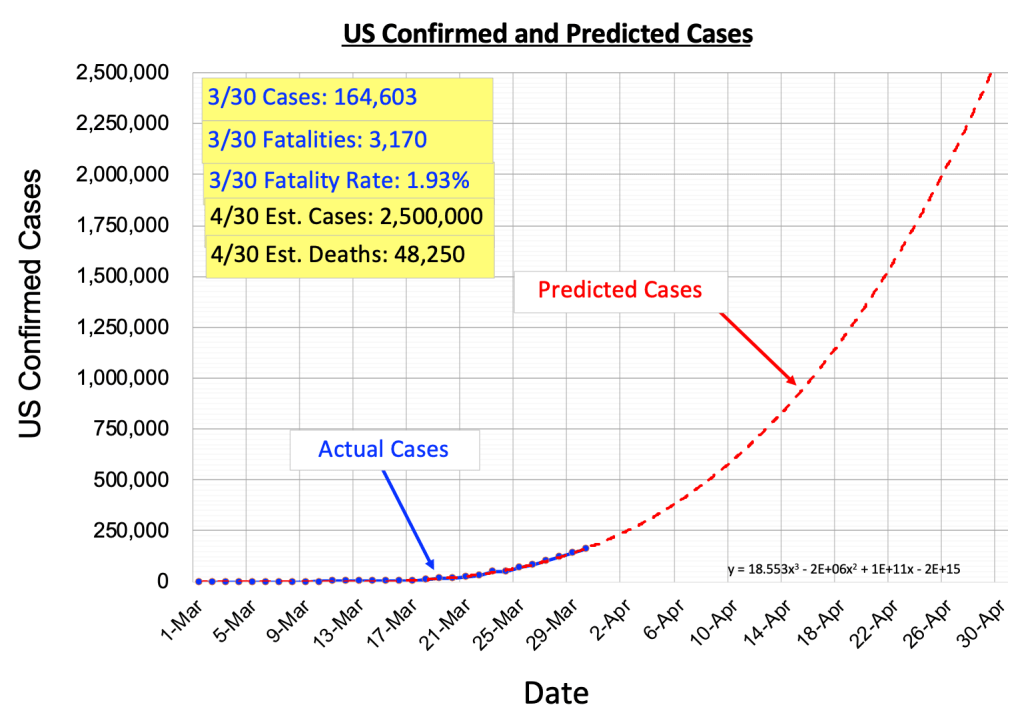
Notice that we have extended the time axis to the end of April. The number of confirmed U.S. cases currently exceeds 164,000. Trends based on my simplified model continue on track to reach ~200,000 cases by the end of March, ~650,000 by Easter, and ~2,500,000 by the end of April. Current estimated fatality rate is about 1.93% corresponding to over 48,000 deaths by April 30. Gloom, I know. The red curve shows some truly frightening numbers. It appears that we are moving beyond gloom & doom and into Stephen King territory.
Bad News: See above.
Good news: Sheltering-in-place should begin to dampen the red curve’s relentless climb upward if strictly followed. The question is — when will we see any effect? The truth? We don’t know. It all depends on the model and the data underpinning the model. I have built countless models over the years, nearly all of which combine many controlling variables — some time-varying, some very noisy, some simply educated guesses. Most of these model inputs are selected by a method known in the vernacular as SWAG’s — Scientific Wild Ass Guesses — not to be confused with the more simplistic WAG’s. Models are only as good as the fidelity of these inputs and, more importantly, the availability of validated data. It is said that one can get a model to output any result you want.
Any predictions right now are snapshots in time. Since so little data capturing the peculiarities of the US situation are available any predictions should be taken with a deer lick or two worth of salt (no, I’m not a hunter). This caution applies to the red curve above. Nevertheless, we should expect that all prediction curves will start bending downward at some point. This plague will end. They always do.
Unless of course Covid takes it upon itself, with the help of a cosmic ray or two, to mutate into a form that cold-shoulders whatever vaccine we might cook up for it. If that happens then the whole deal starts over. But that’s a different story. History suggests this likelihood is low.
So here we are — hoping the curves start behaving the way we want them to, and fast. Unfortunately we need more data to pin down a date. Consider the following clipping:
State-by-state projection shows when Wisconsin will peak during pandemic — March 31, 2020 3:32 am WQOW Eau Claire ABC News
MADISON (WQOW) – A new analysis predicts Wisconsin will make it through the coronavirus pandemic without a shortage in hospital beds if social distancing mandates are maintained.
The University of Washington’s Institute for Health Metrics & Evaluation (IHME) released an interactive projection for every state. That analysis found Wisconsin’s peak resource use will come in 53 days, on May 22, as of Sunday. On Monday, the data changed, indicating the state would peak in 26 days, on April 26. There could be a shortage of 360 ICU beds, but not overall hospital bed space, according to the prediction.
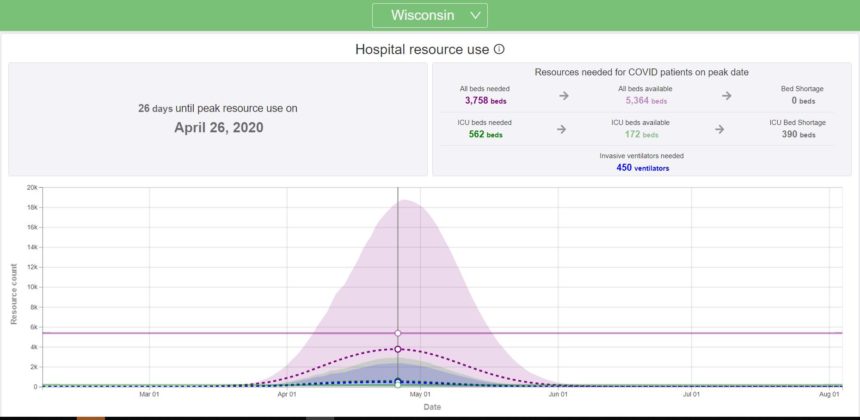
That indicates social distancing measures could work as intended to flatten the curve, if they stay in place and people continue to stay at home, as the governor ordered. “The models are only as good as the data that goes into it. And the best models learn from the previous day’s data,” said UW Health Chief Quality Officer Dr. Jeff Pothof. “They’re immensely helpful if they’re accurate, because it kind of helps us know what we’re up against. But at the same time, there always has to be a bit of suspicion on whether or not it’s accounted for all the variables, or if there’s something that it’s missing, that maybe we’re doing.”
These guys are credible researchers. This illustrates where we are right now: Get more data, update the model, then wait another week or so and see how the curves behave. If cases continue sweeping upward we have no choice but to wait another week or so and repeat.
Eventually good news will happen. My WAG for the US peak right now? Sometime in April / May, tapering into the summer. Too vague? What do you expect, it’s not even a SWAG. I also have a WAG on total cases and fatalities by the end of the year… ( … deep-voiced announcer guy: “tune in next time” … ).
Hmmm… seems like all of this should probably be up in the bad news section — except for the part about the curve inevitably falling.

The “doom clock” continues ticking forward. Now 7 seconds to midnight.
